Case study — Drone light shows
The report nobody opened
Redesigning a regulatory safety report its recipients had stopped using, replaced by a twenty-minute manual workaround on every mission.
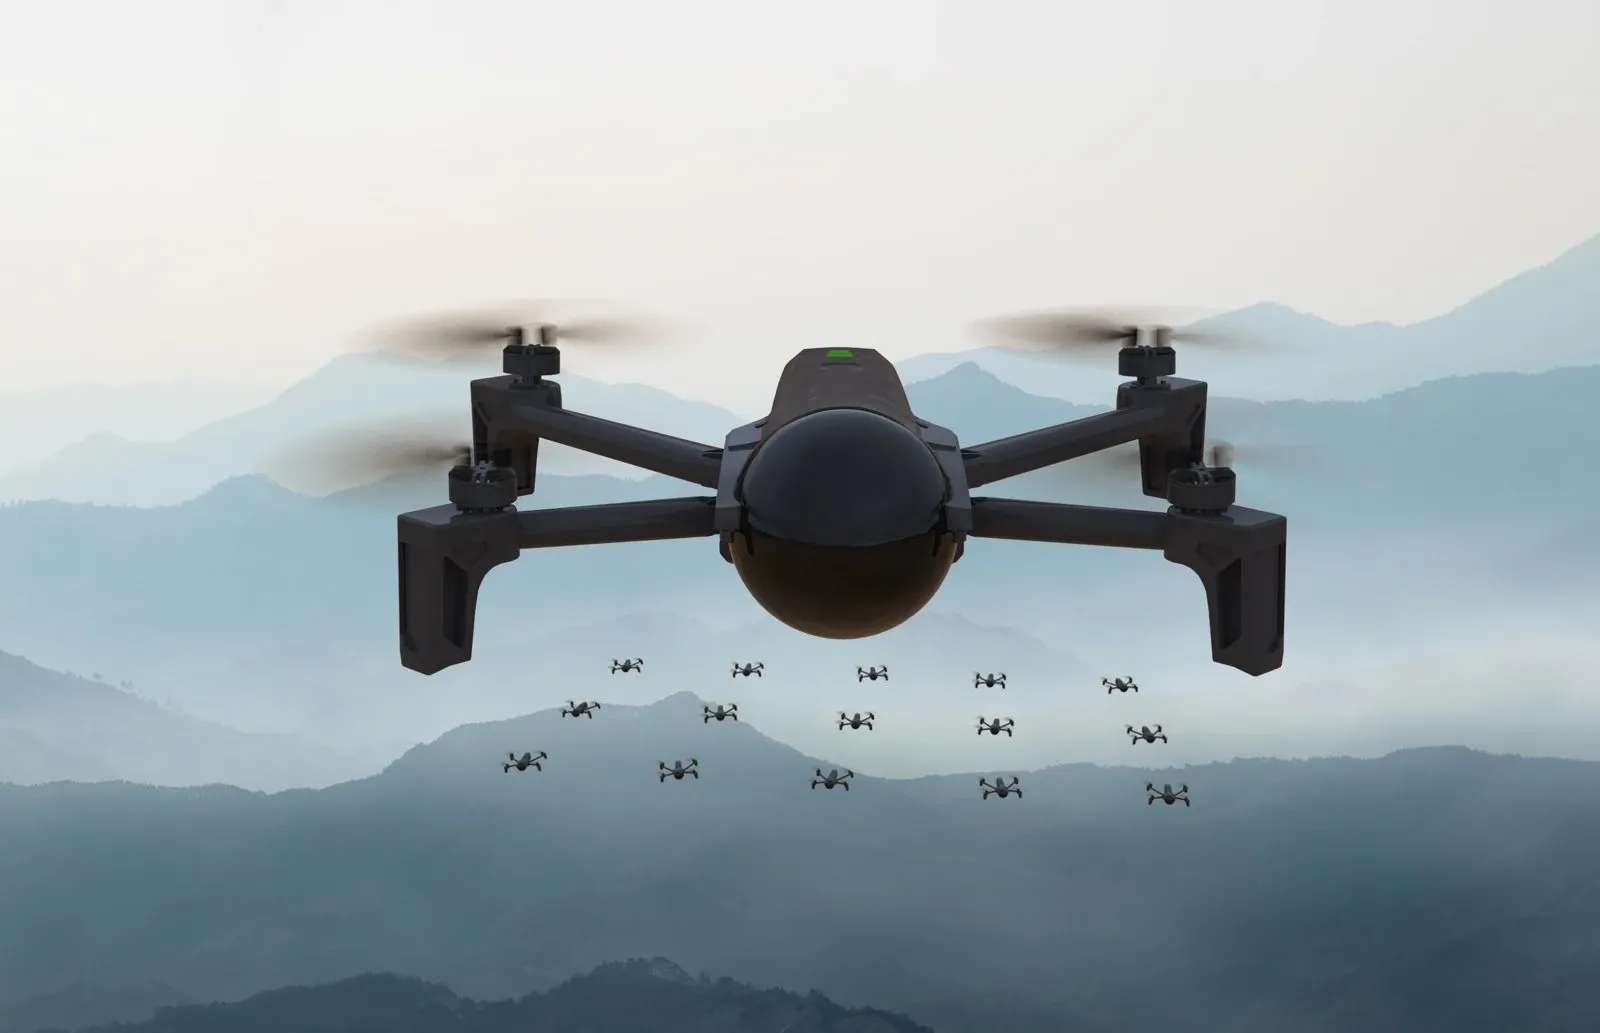
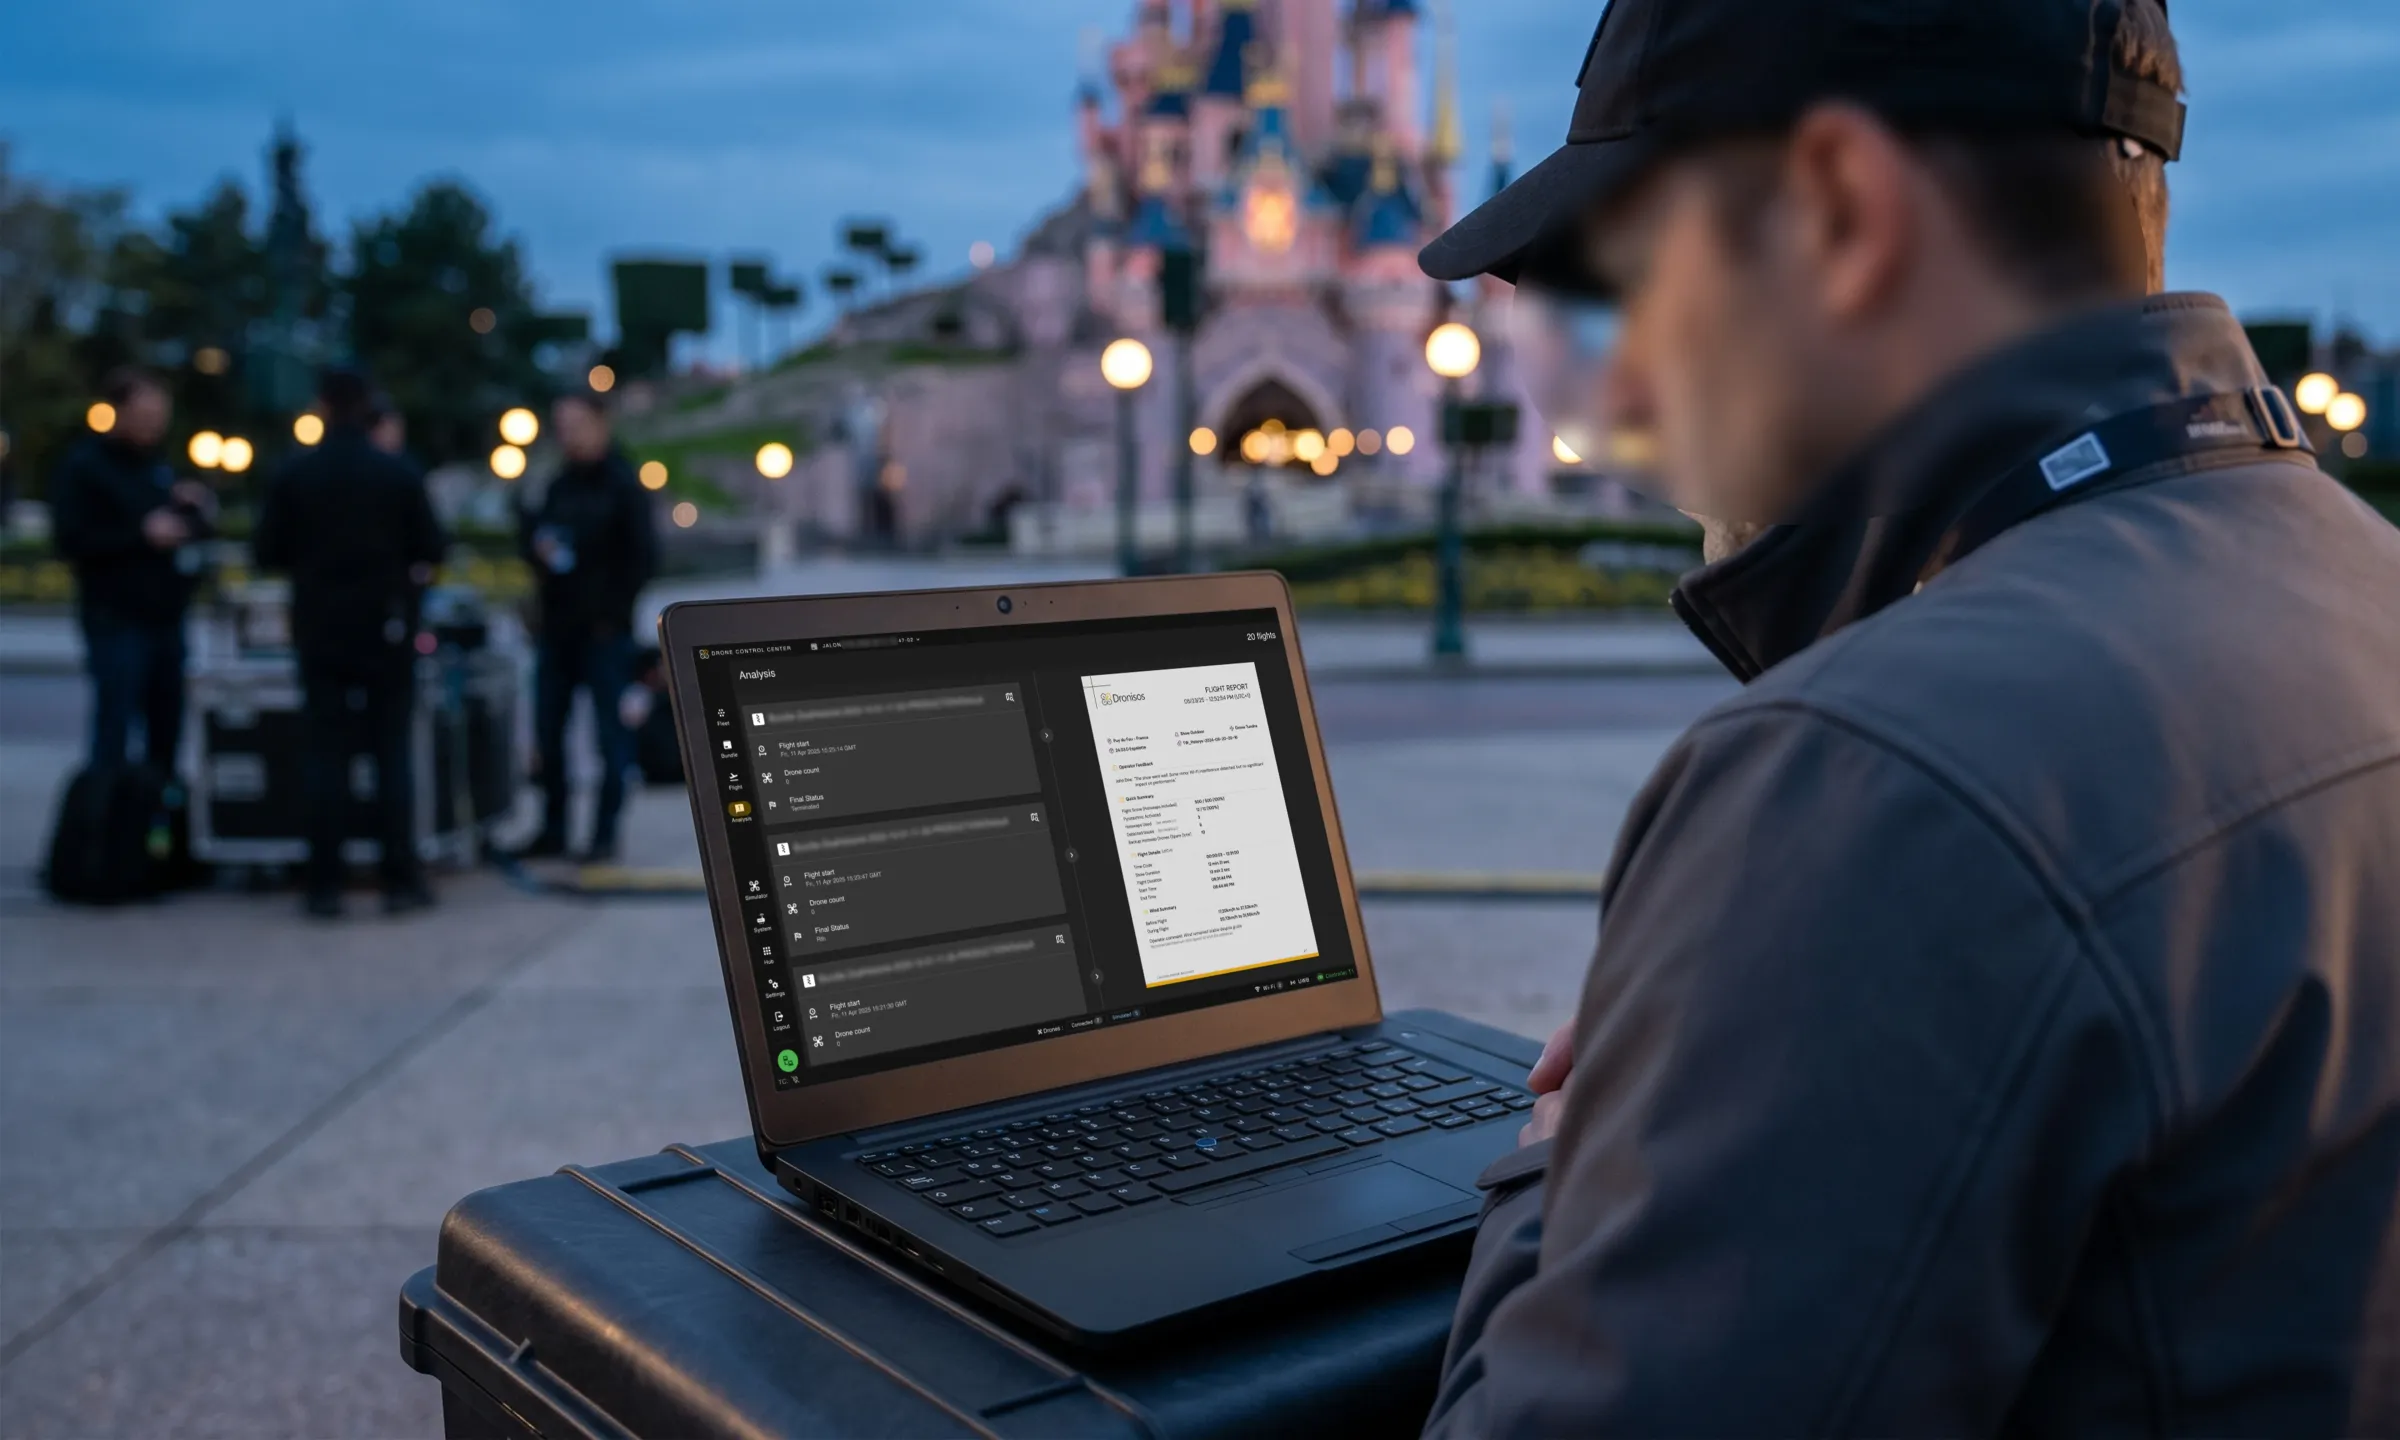
The client is not named in this study, and neither are its operating sites. The field, the tools and the control station are: without them, only an abstract account would remain. It is the rule I apply to what I publish: what I design for an organisation is not mine, the reasoning that got me there is.
Context
The operator produces drone swarm shows over sites open to the public. Every flight falls under the French civil aviation authority (DGAC): traceability of mission data is not good practice there, it is a regulatory obligation.
The internal software ecosystem covered mission preparation, an RTK base for precision positioning, and the in-flight Drone Control Center (DCC). I joined the team as a Product Designer; PRD authoring was handed to me very quickly, on top of design direction. Product vision and design therefore ended up in the same hands, with no intermediate filter.
Problem
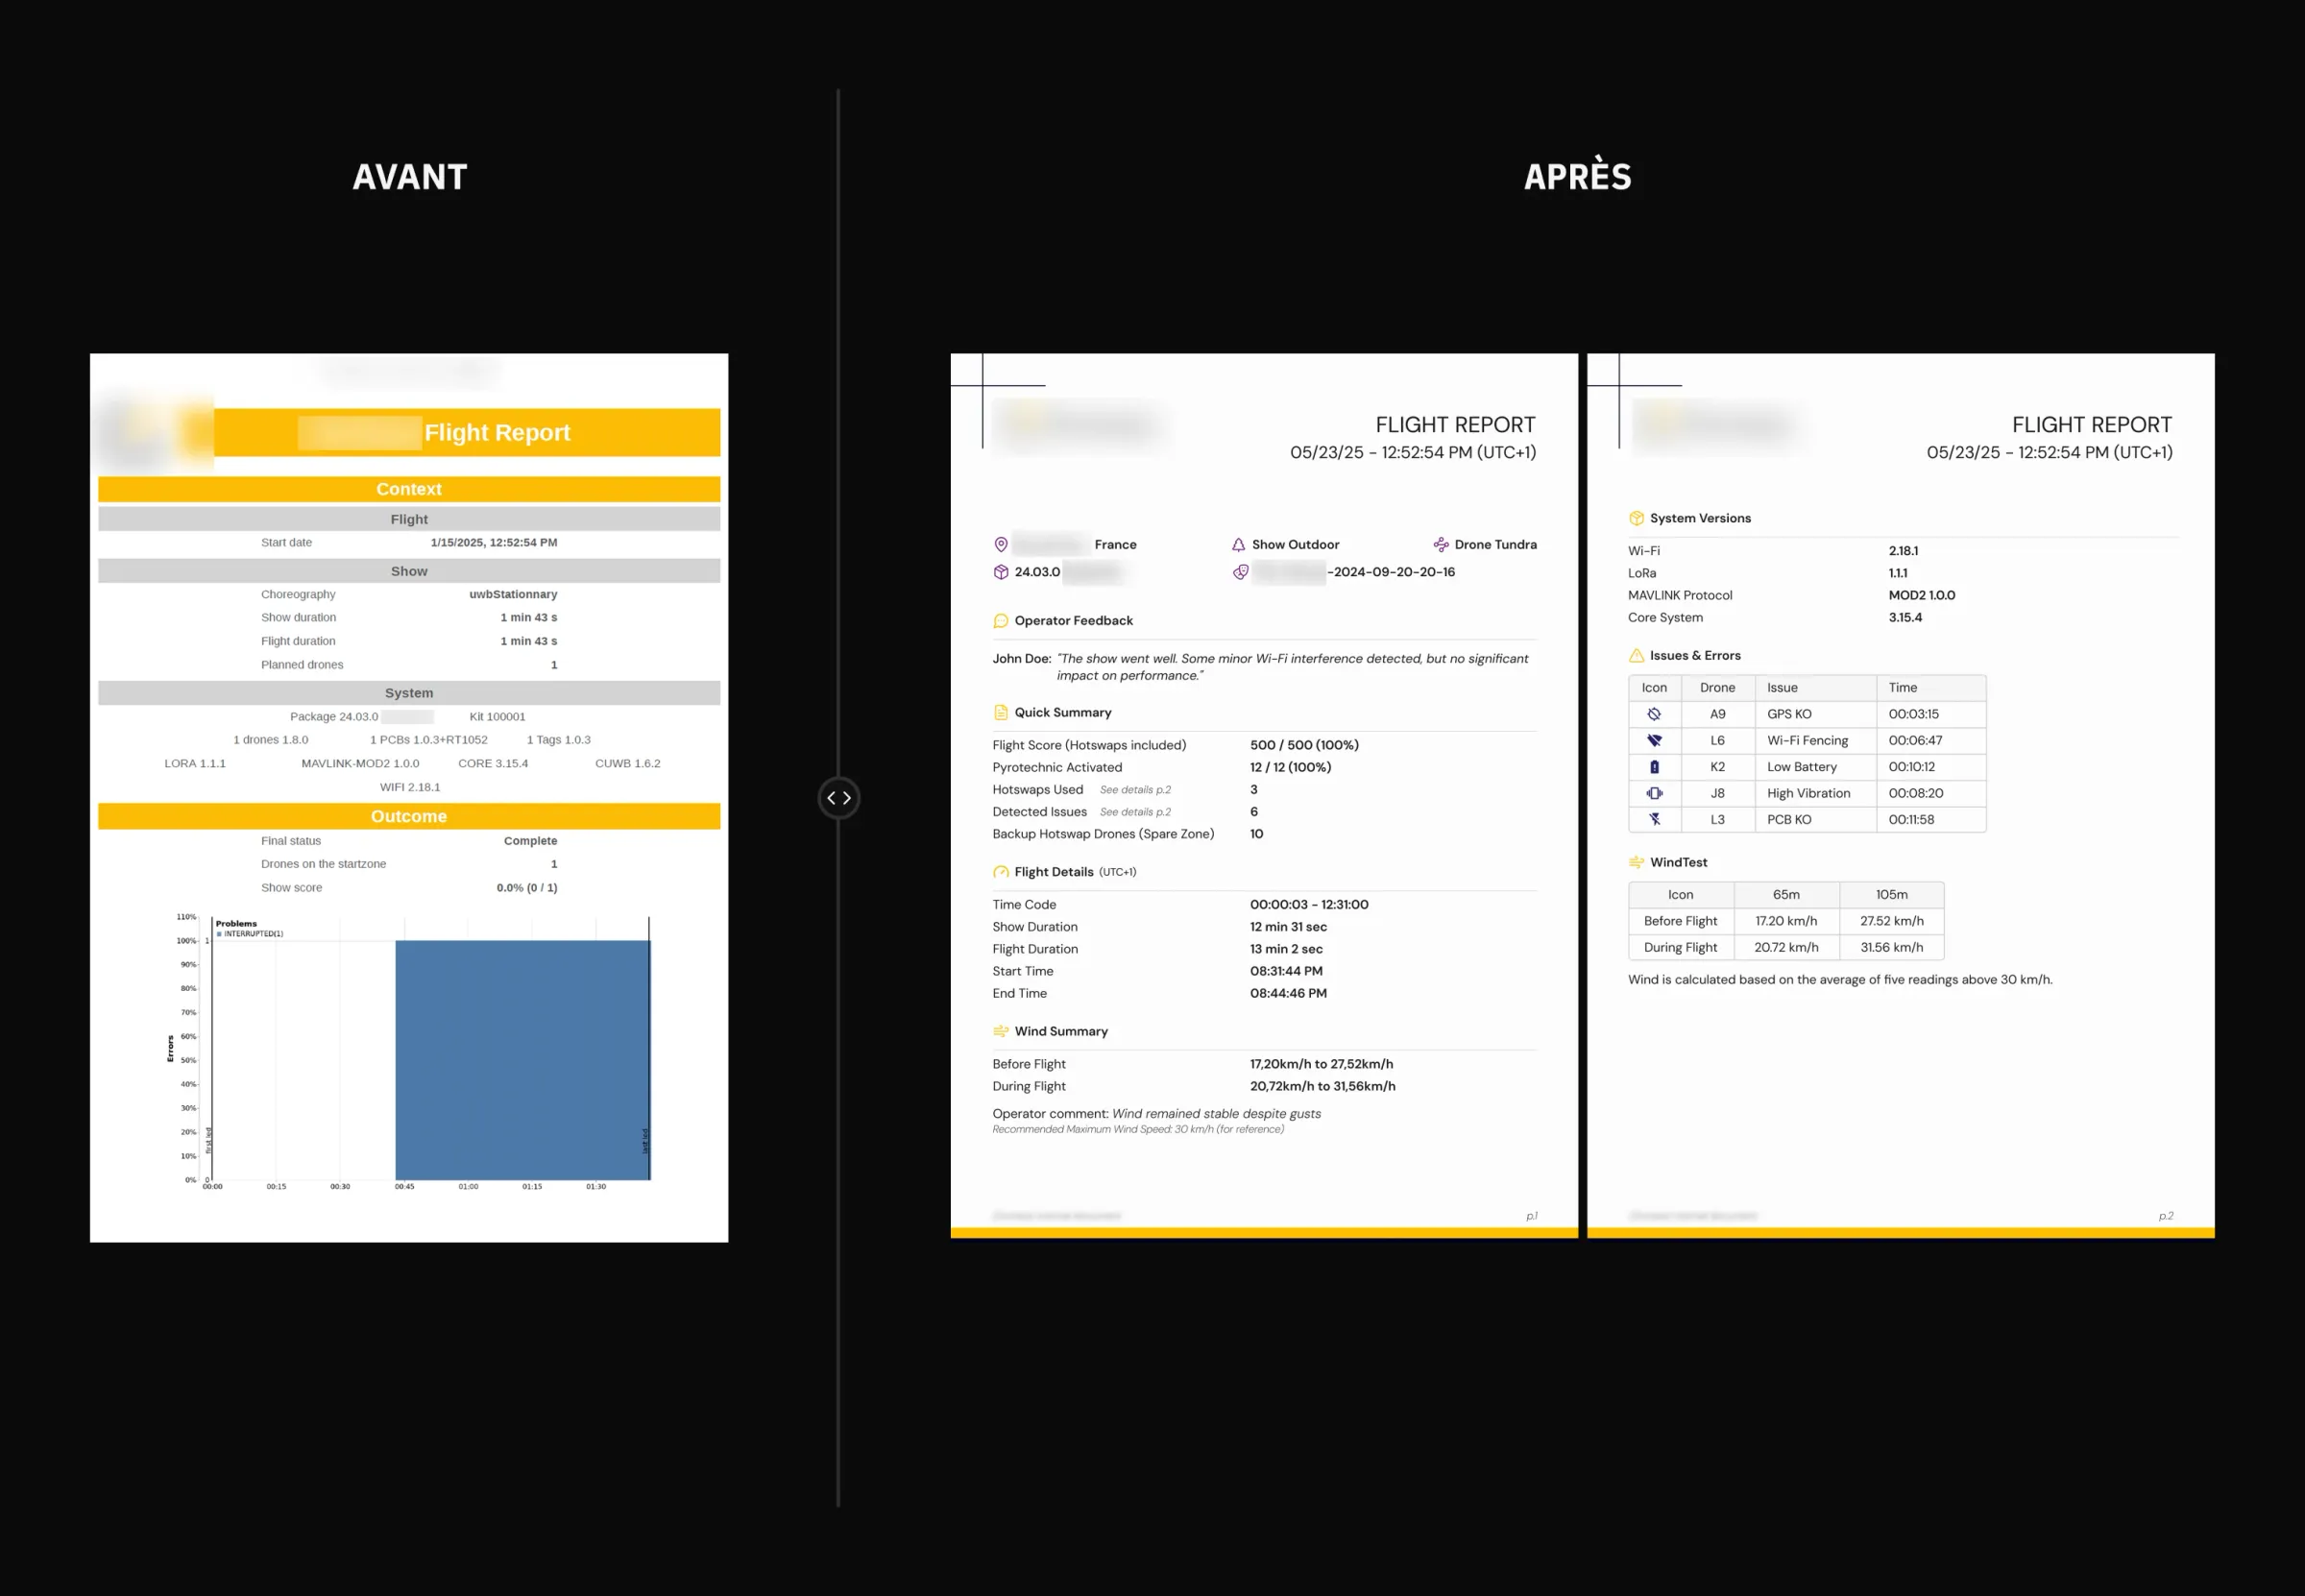
After each flight, the DCC automatically generated a tabular PDF report: internal, hard to read. In practice, nobody opened it.
Instead, the flight director wrote a Slack message summarising wind speed, battery state and incidents. An operator then re-entered that information into a shared Google Sheet, with no imposed format. The result: about twenty minutes of manual work per mission, three sources of truth that could contradict each other, and post-flight analysis that was structurally impossible to industrialise. For an activity whose safety is the primary commercial argument, that tooling gap was becoming a risk.
The first instinct would have been to redesign the report. It is the second one that counts: a regulatory deliverable its own recipients route around is not an aesthetic problem, it is a traceability failure.
Challenge 01 — Understanding why the report went unread
The challenge: before redesigning anything, understand why an already-automated artefact had been abandoned by its own users.
My approach: in sprint 1, I ran interviews with flight directors, field operators and the analysis team. The existing report stacked three things into a single table: raw telemetry, technical fields meant for developers, and the handful of indicators actually useful at debrief. The tabular format made it impossible to isolate critical information quickly. First among them, the 35 km/h wind threshold being exceeded, which governs the decision to take off.
Outcome: a three-layer map of needs. The immediate decision in the field, the operational debrief, the regulatory archive: three layers that shared neither audience nor time horizon, and that served as the grid for everything that followed.
Challenge 02 — Designing an editorial report that fits on two pages
The challenge: present a flight's telemetry in a document a flight director can scan in under a minute, while staying compliant with what the DGAC expects.
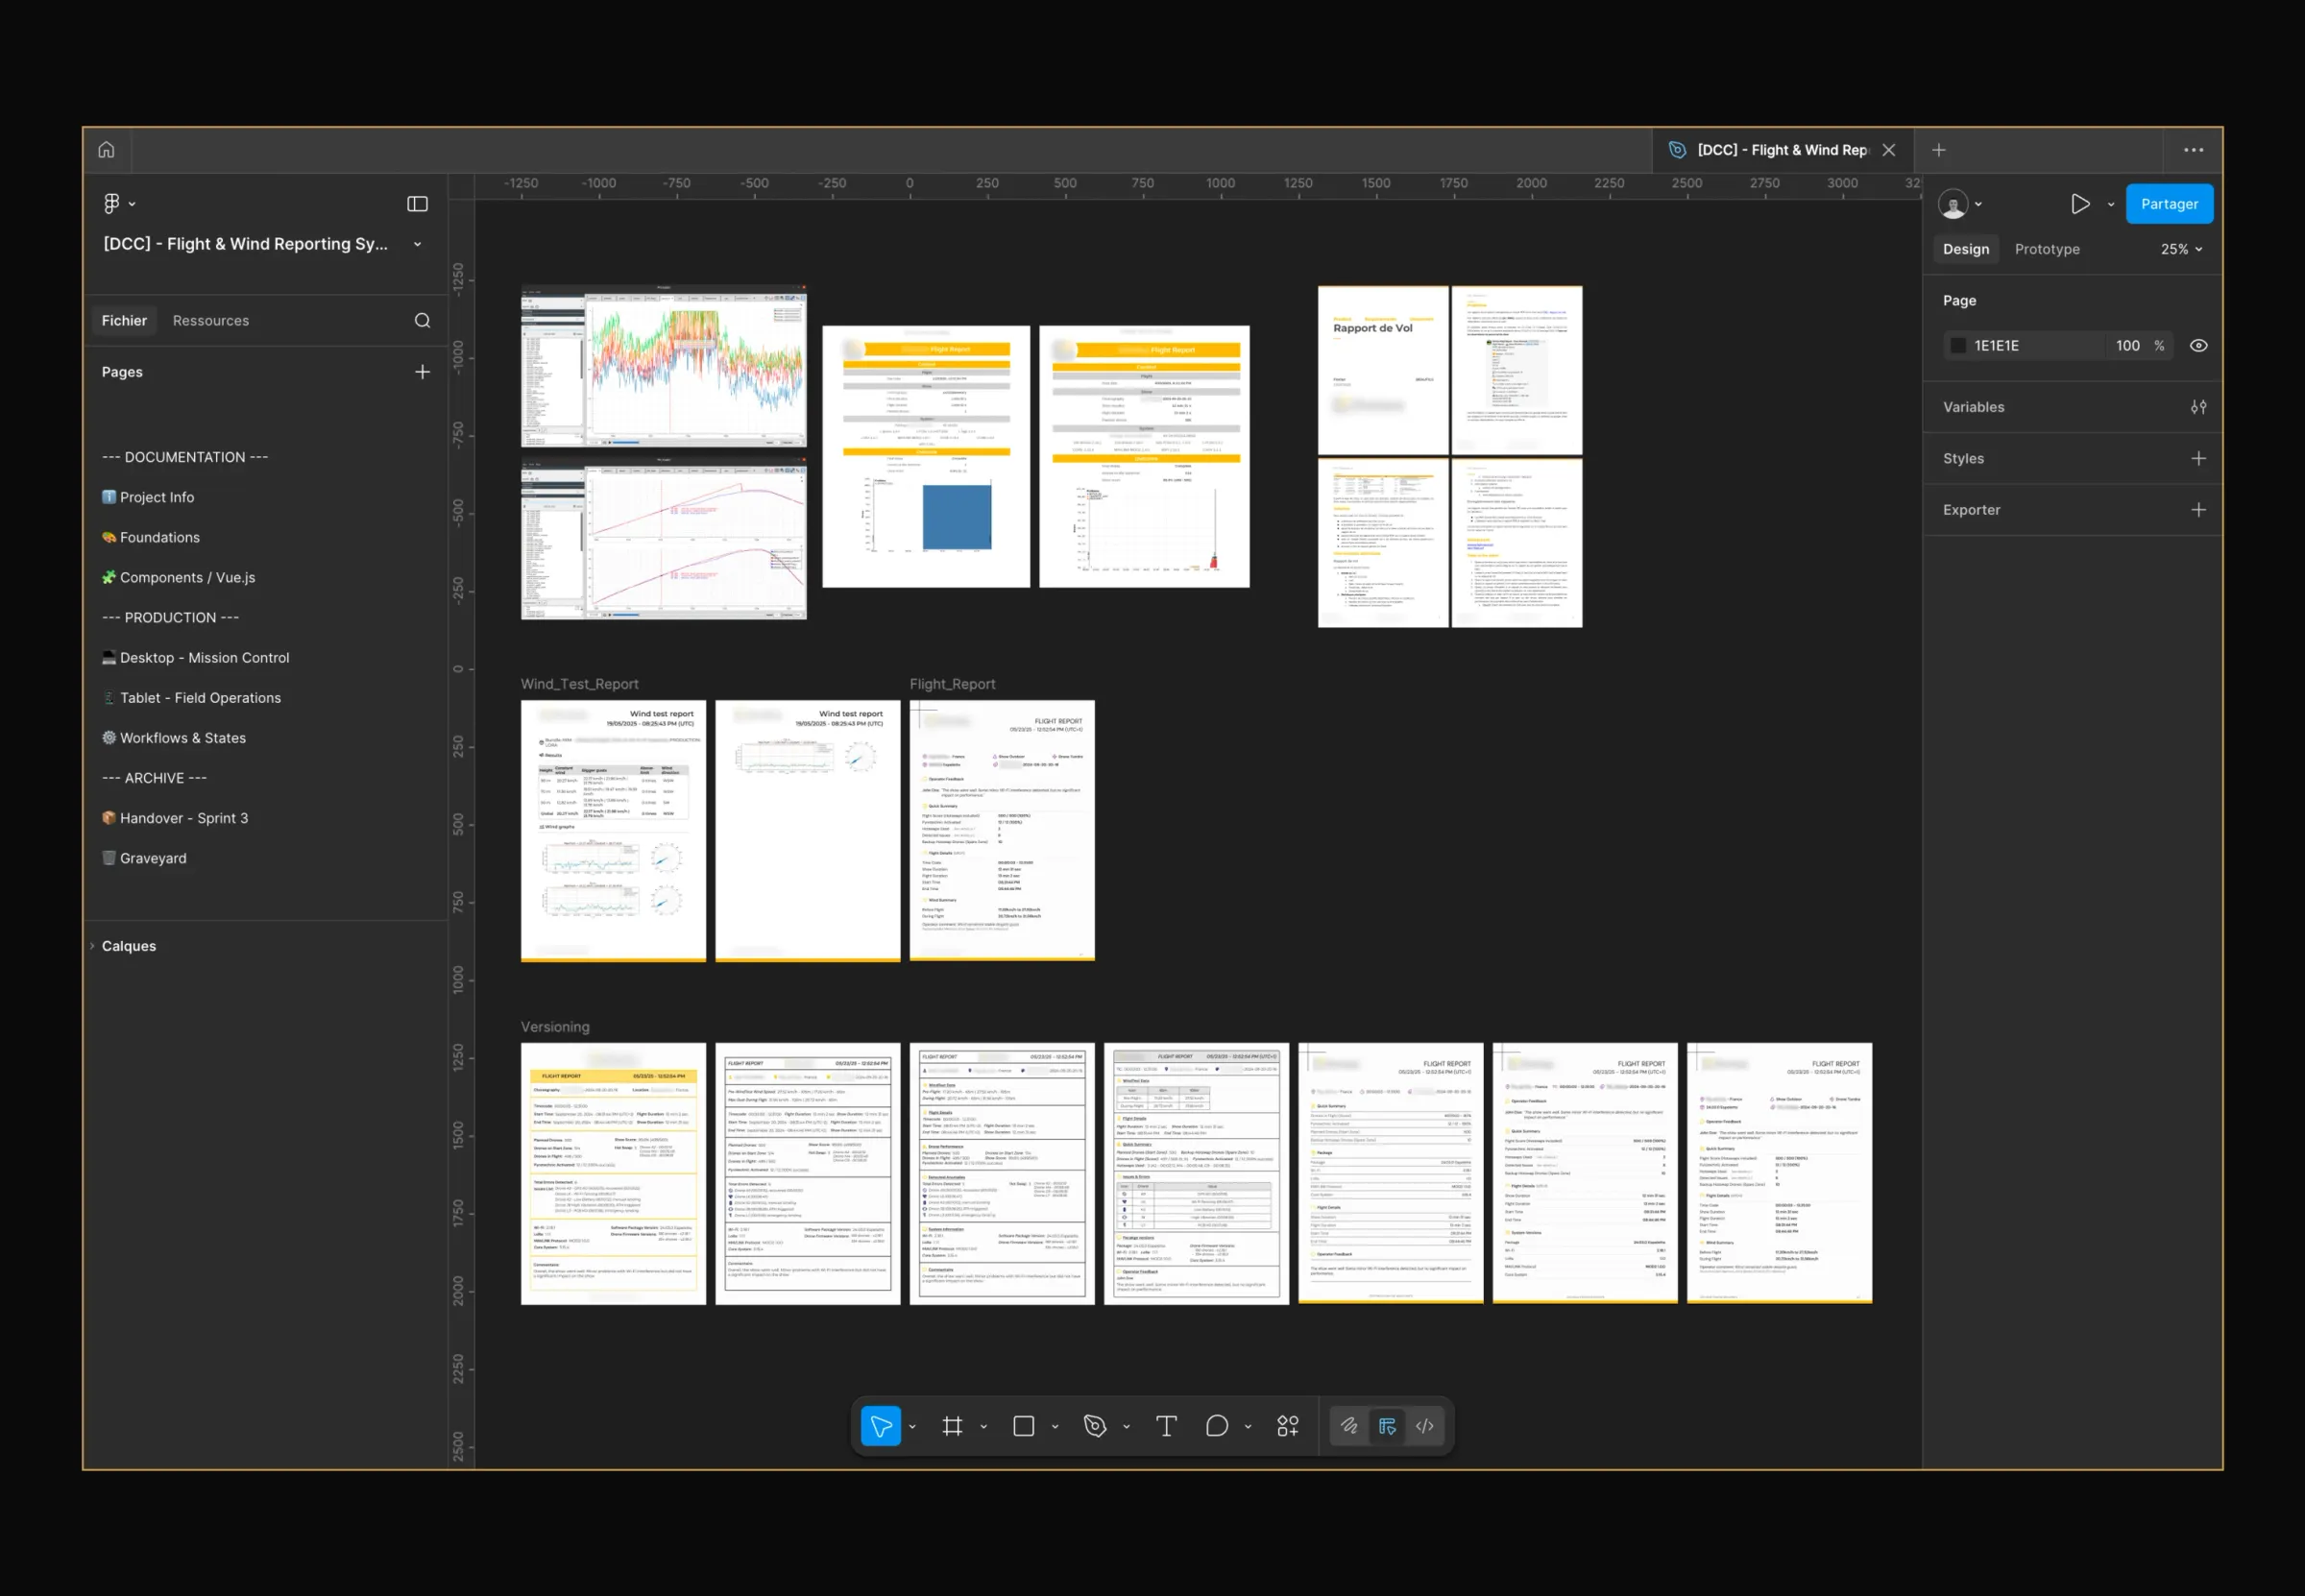
My approach: I treated the report as an editorial document, not an admin view. Page 1: an Operator Feedback block open to free input from the flight director, placed first because it is the only information no sensor produces, then a Quick Summary (Flight Score, Pyrotechnic Activated, Hotswaps Used, Detected Issues, Backup Hotswap Drones), the Flight Details and the Wind Summary. Page 2: the System Versions and the Issues & Errors table, qualified by severity. Alongside it, I built a dedicated design system in Figma (foundations, Vuetify components, workflows and states), documented across seven iterations versioned with the developers.
Outcome: a single deliverable replacing, all at once, the abandoned PDF, the manual Slack message and the spreadsheet re-entry.
Challenge 03 — Wiring the interface to the data pipeline
The challenge: a report is only worth something if its generation is reliable and its archiving traceable. Design rarely stops at the mockup.
My approach: I led the pipeline design with the PM.
Ingestion of flight logs (.ulog, .bin),
correlation with anemometer readings, PDF generation from the DCC's
analysis page, automatic deposit into a Google Drive tree
compliant with the DGAC's requirements, Slack notification to the
flight director with a direct link. On the UX side, the stake was keeping
a human checkpoint: the flight director can edit the report before
archiving, but the default path requires no action at all.
Outcome: an unbroken chain from raw data to regulatory archive, with no re-entry anywhere.
The report production chain
From log ingestion to deposit in the archive, by way of weather correlation and generation. Mark the optional human checkpoint and the default path distinctly. No real folder structure, no client site.
21 : 9
The interviews as a source of truth
They spent more time compiling the information than analysing it. The double entry, Slack then a spreadsheet, was not a preference: it was a symptom. The existing automated report answered no real use case.
Synthesis of the sprint 1 interviews with flight directors and field operators.
Iterations and design decisions
Seven documented versions, only one of which genuinely changed the project's direction.
V0 proposed a single dense page, close to a dashboard. Internal testing showed it reproduced the original flaw: plenty of signals, no hierarchy.
V3 introduced the editorial break (Operator Feedback as the opening, Quick Summary turned visual, Issues & Errors moved to the end of the document) and the move to two pages. The decision to keep two pages rather than one was argued with the PM: explicit pagination allows printing for the field and improves linear reading. Two needs raised by operators, not two designer preferences.
V4 to V6 refined the typography and the qualification of incidents by severity. V7, delivered as the sprint 3 handover, is the one that went into production.
Results and impact
- ~20 minutes saved per mission on post-flight analysis.
- 100 % centralisation of the contractual flows, from raw data to regulatory archiving.
- Critical wind threshold made immediately legible on the report and in the Slack notification.
- Regulatory compliance ensured by automated archiving into the folder structure the DGAC expects.
- Versioned design system across seven documented iterations, handed over to the development teams in sprint 3.
Reflection
An abandoned deliverable is not always a design problem. Here it was a product framing problem. Carrying the PRD alongside the design made it possible to align technical scope with real business needs, with no intermediary filtering either one.
The regulatory constraint sped decisions up. I expected a brake, it turned out to be a referee. The traceability obligation forced the team to designate a single source of truth, which simplified the architecture instead of weighing it down.
I tested too late with part of the users. Flight directors were consulted from sprint 1, but the operators who read the report on the move, on tablet, only in sprint 2. The tablet side was caught up later; it should have been framed upfront.